Reports
Report panels are written by Cognify and are read-only: no new rows, no imports, no automations, no integrations. For reading, they behave like any other panel, filters, charts and export all work.
The three reports
| Report | Records | Appears when |
|---|---|---|
| Audit Logs | Every change in the workspace: what changed, when, who did it, which module and which action | Audit Log is switched on in Settings |
| User Activity | Maker-checker requests: the activity, the action, the feature, who asked, who reviewed and the outcome | Maker Checker is switched on in Settings |
| <Panel> SLA | One row per ticket, with timings and SLA outcome | Created automatically with every Ticketing panel |
They are listed under Reports in the sidebar.
The SLA report in detail
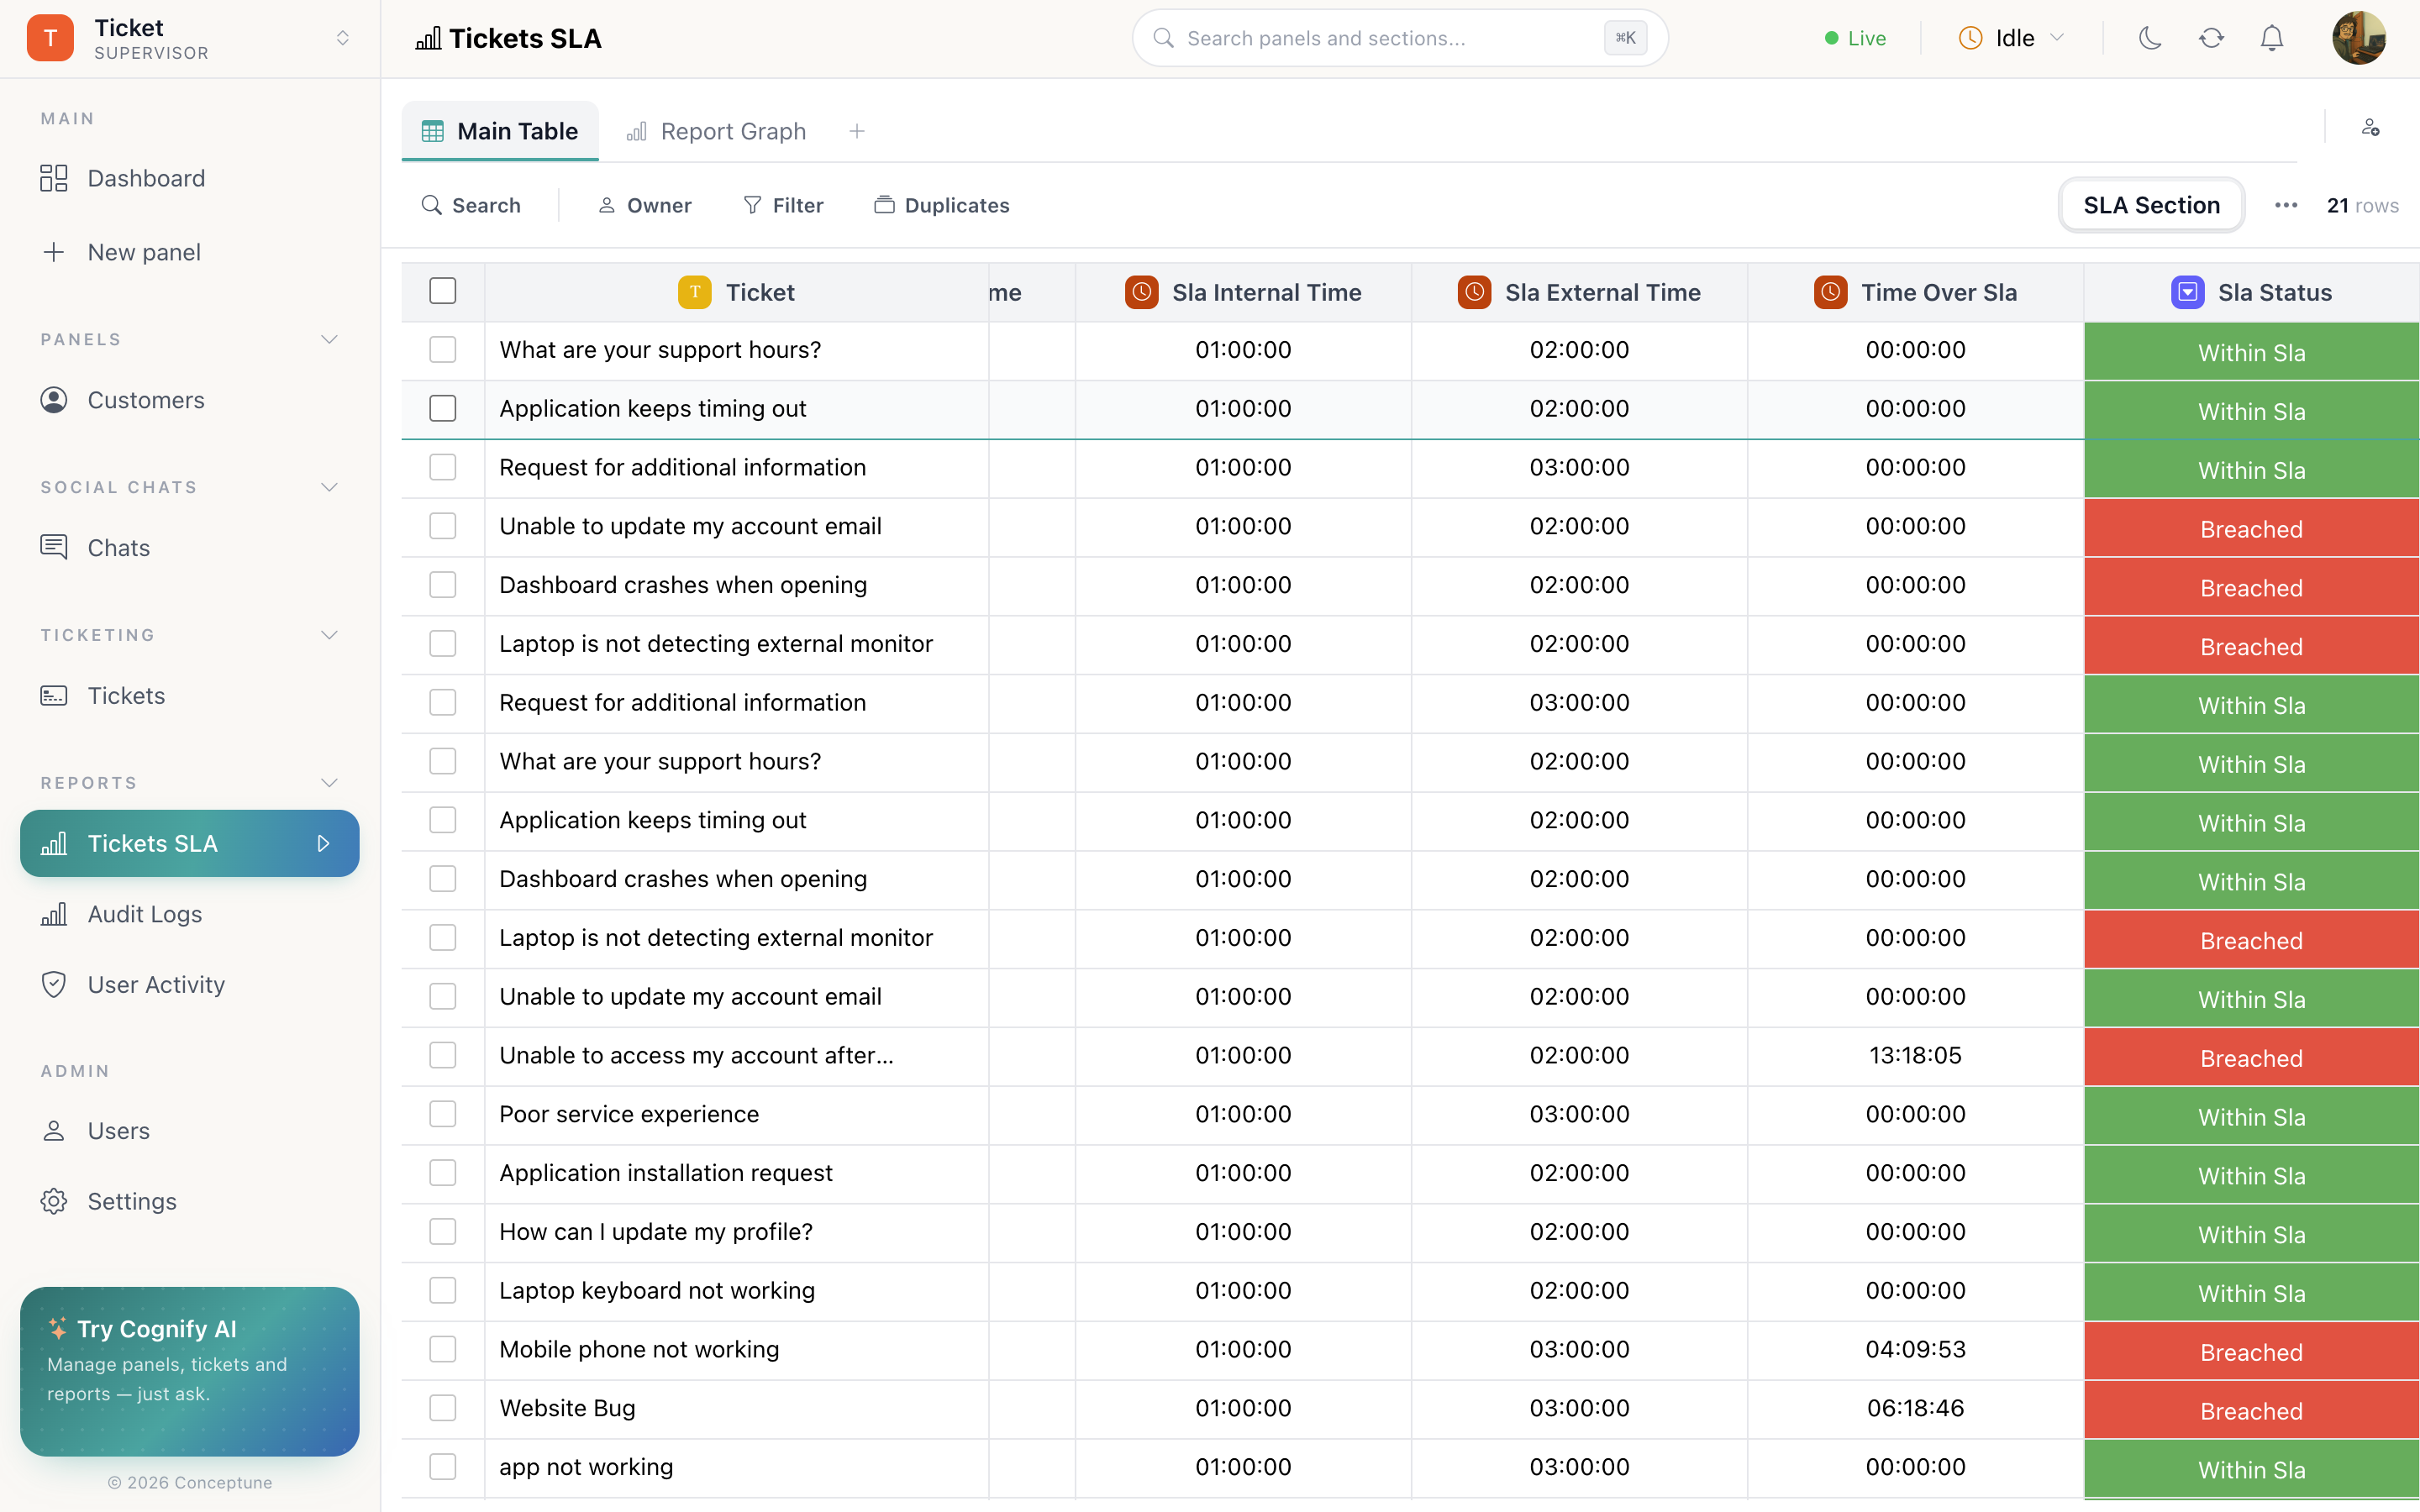
The most useful of the three, and the one that fills itself as tickets move. Its columns:
| Column | What it holds |
|---|---|
| Ticket | The ticket this row describes |
| Owner | Who was responsible |
| Category | Which category's targets applied |
| Ticket Status | Where it ended up |
| Raised At | When it arrived |
| Assigned At | When someone took it |
| Resolved At | When it was finished |
| Resolution Time | How long it took. Averages in the footer |
| SLA Internal | The internal target that applied |
| SLA External | The external target that applied |
| Time Over SLA | How far past, when it went past. Sums in the footer |
| SLA Status | Not Started, Within SLA, At Risk or Breached |
| SLA Breached | A clean yes/no for charting |
| Reassignments | How many times it changed hands |
| Snapshot | A frozen copy of the ticket at that moment |
Because Resolution Time averages and Time Over SLA sums in the footer, a section total answers “how are we doing” with no setup at all.
Snapshots
A Snapshot column holds a frozen copy of a row as it was at a moment in time. Open it and Data Snapshot shows the ticket's fields exactly as they stood, useful when a ticket has since been reassigned, recategorised or reopened, and you need to know what was true when the clock ran.
Audit logs
Switch Audit Log on in Settings → Preferences and Cognify starts writing every workspace change into a report: what changed, when, who, which module, which action.
This is the record you will want if you ever need to answer “who changed this and when” after the fact. It only covers activity from the moment it was switched on, so turn it on early rather than when you need it.
Charting a report
Reports take a Graphs tab like any panel. The most valuable one to build: a widget on SLA Breached or SLA Status, pinned to the dashboard, so breach rate is visible without anyone opening the report.
What you cannot do
- Add rows by hand, or import them.
- Attach automations or integrations.
- Edit the values, they describe what happened.
You can filter, chart, export and read. Everything else is written by Cognify.
How do I…
Turn on audit logging: Settings → Preferences → Audit Log.
Chart breach rate: Open the SLA report → Graphs tab → add a widget on SLA Breached or SLA Status → pin it to the dashboard.
See a ticket as it was: Open the SLA row → the snapshot column → Data Snapshot.
Export a report: Section ⋯ → Export, the same as any panel.